


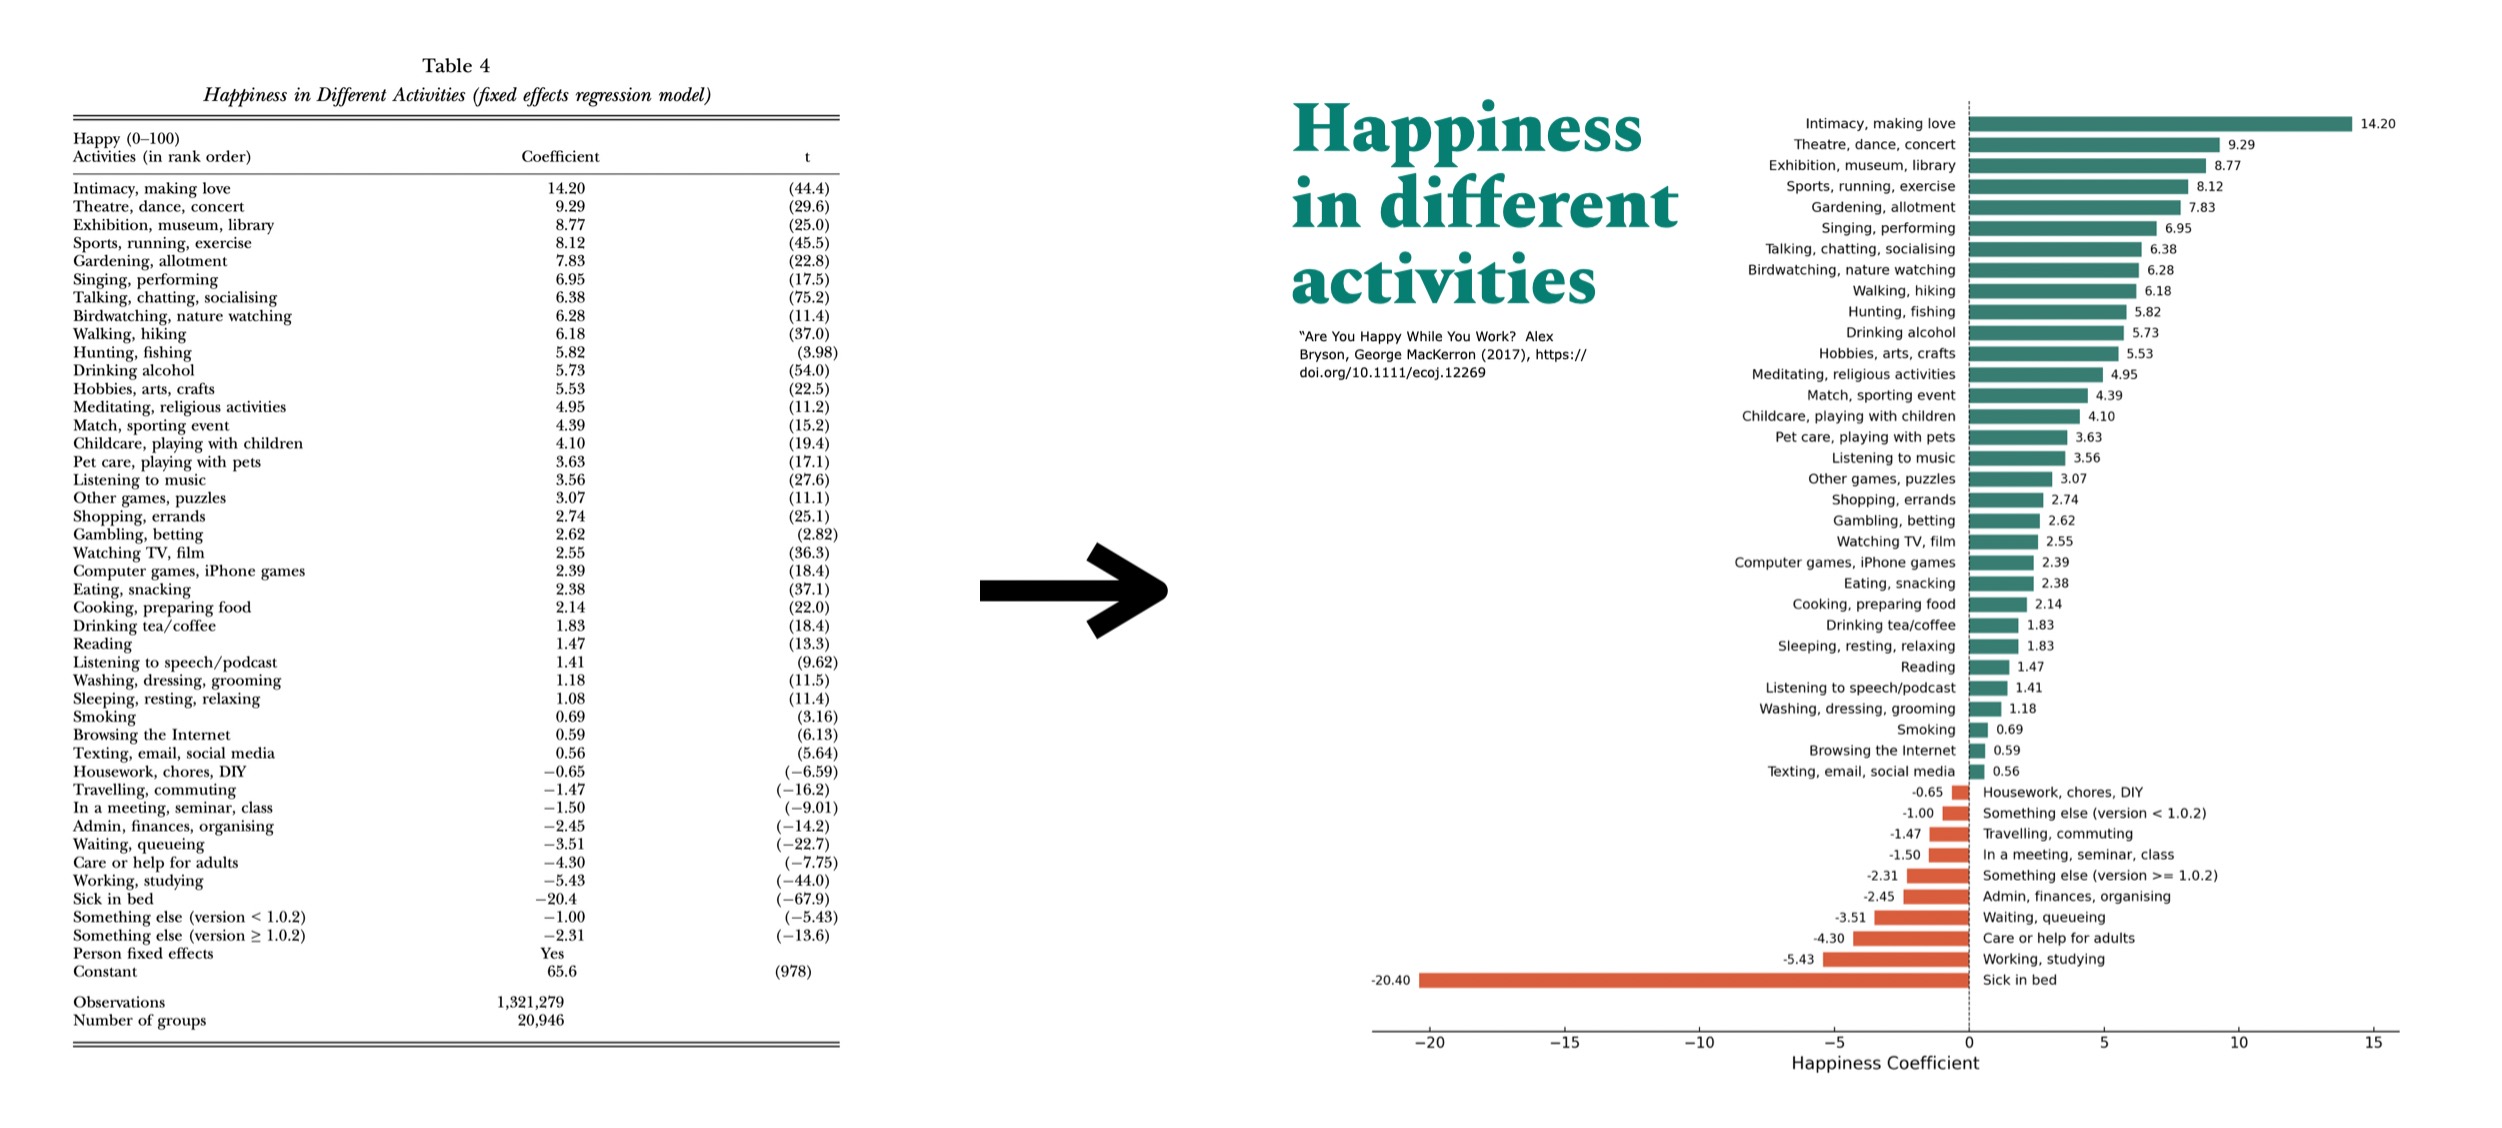
Well, “love” and “being sick in bed” are pretty clear. But what really surprised me was “Gardening, allotment” ranking in the TOP-4. Now I get why so many people end up buying a dacha or small village house at some point – it is much more effective than drinking, and almost no health downsides.
The second thing “Birdwatching” – I have never thought it is something real. But, hey, seems quite effective.
Source:
1. Are You Happy While You Work?, Alex Bryson, George MacKerron (2017), https://doi.org/10.1111/ecoj.12269
Code:
# Import required libraries
import pandas as pd
import matplotlib.pyplot as plt

# Data from research
data = {
    "Activity": [
        "Intimacy, making love", "Theatre, dance, concert", "Exhibition, museum, library",
        "Sports, running, exercise", "Gardening, allotment", "Singing, performing",
        "Talking, chatting, socialising", "Birdwatching, nature watching", "Walking, hiking",
        "Hunting, fishing", "Drinking alcohol", "Hobbies, arts, crafts",
        "Meditating, religious activities", "Match, sporting event",
        "Childcare, playing with children", "Pet care, playing with pets",
        "Listening to music", "Other games, puzzles", "Shopping, errands",
        "Gambling, betting", "Watching TV, film",
        "Computer games, iPhone games", "Eating, snacking", "Cooking, preparing food",
        "Drinking tea/coffee", "Reading", "Listening to speech/podcast", "Washing, dressing, grooming",
        "Sleeping, resting, relaxing", "Smoking", "Browsing the Internet",
        "Texting, email, social media", "Housework, chores, DIY", "Travelling, commuting",
        "In a meeting, seminar, class", "Admin, finances, organising",
        "Waiting, queueing", "Care or help for adults", "Working, studying",
        "Sick in bed", "Something else (version < 1.0.2)", "Something else (version >= 1.0.2)"
    ],
    "Coefficient": [
        14.20, 9.29, 8.77, 8.12, 7.83, 6.95, 6.38, 6.28, 6.18, 5.82, 5.73, 5.53,
        4.95, 4.39, 4.10, 3.63, 3.56, 3.07, 2.74, 2.62, 2.55, 2.39, 2.38, 2.14,
        1.83, 1.47, 1.41, 1.18, 1.83, 0.69, 0.59, 0.56, -0.65, -1.47, -1.50,
        -2.45, -3.51, -4.30, -5.43, -20.4, -1.00, -2.31
    ]
}

# Create and sort DataFrame by coefficient
df = pd.DataFrame(data)
df_sorted = df.sort_values(by="Coefficient", ascending=True)

# Plotting
plt.figure(figsize=(12, 12))  # Set figure size
ax = plt.gca()
ax.set_facecolor('white')  # White background

# Define bar colors: greenish (#067F72) for positive, red (#EA532E) for negative
colors = ['#067F72' if coeff >= 0 else '#EA532E' for coeff in df_sorted['Coefficient']]

# Plot horizontal bars
bars = ax.barh(df_sorted["Activity"], df_sorted["Coefficient"], height=0.7, color=colors)

# Title and labels
plt.title("Happiness in Different Activities", fontsize=18, color='black', pad=20)
plt.xlabel("Happiness Coefficient", fontsize=14, color='black')

# Vertical line at zero
plt.axvline(x=0, color='black', linestyle='--', linewidth=0.8)

# Add activity labels and coefficients next to bars
for bar, activity, coeff in zip(bars, df_sorted["Activity"], df_sorted["Coefficient"]):
    width = bar.get_width()
    y_pos = bar.get_y() + bar.get_height() / 2
    # Activity label position
    label_x_pos = -0.5 if width > 0 else 0.5
    ha_label = 'right' if width > 0 else 'left'
    plt.text(label_x_pos, y_pos, activity, ha=ha_label, va='center', fontsize=11, color='black')
    # Coefficient label position
    plt.text(width + (0.3 if width > 0 else -0.3), y_pos, f"{coeff:.2f}",
             ha='left' if width > 0 else 'right', va='center', fontsize=10, color='black')

# Remove y-axis tick labels (as we already added custom labels)
plt.yticks([])

# Remove grid lines
ax.grid(False)

# Set axes colors to black
ax.tick_params(axis='x', colors='black')
ax.tick_params(axis='y', colors='black')

# Set axis spine (borders) to black and hide unnecessary ones
for spine in ax.spines.values():
    spine.set_visible(False)
ax.spines['bottom'].set_visible(True)
ax.spines['bottom'].set_color('black')

# Adjust layout for better appearance
plt.tight_layout()

# Display plot
plt.show()


8 thoughts on “Which activities increase or decrease our happiness?”